Monday, September 23, 2013

Change of address: blog.abegong.com

I've moved!  Since finishing grad school, I've decided to fold my personal web page and blog together.  In the future, I'll be posting to http://blog.abegong.com.

Also, my posts will focus on "data science" instead of "computational social science."  They're pretty much the same thing, but "data science" seems to be the phrase that's catching on.

See you there!

Wednesday, July 10, 2013

Speed up hadoop development with progressive testing

Debugging Hadoop jobs can be a huge pain.  The cycle time is slow, and error messages are often uninformative --- especially if you're using Hadoop streaming, or working on EMR.

I once found myself trying to debug a job that took a full six hours to fail.  It took more than a week -- a whole week! -- to find and fix the problem.  Of course, I was doing other things at the same time, but the need to constantly check up on the status of the job was a huge drain on my energy and productivity.  It was a Very Bad Week.


Painful experiences like this have taught me to follow a test-driven approach to hadoop development.  Whenever I'm working on a new hadoop-based data pipe, my goal is to isolate six distinct kinds of problems that arise in hadoop development.

  1. Explore the data: The pipe must accept data from a given format, which might not be fully understood at the outset.
  2. Test basic logic: The pipe must execute the intended data transformation for "normal" data. 
  3. Test edge cases: The pipe must deal gracefully with edge cases, missing or misformatted fields, rare divide-by-zeroes, etc. 
  4. Test deployment parameters: The pipe must be deployable on hadoop, with all the right filenames, code dependencies, and permissions.
  5. Test cluster performance: For big enough jobs, the pipe must run efficiently.  If not, we need to tune or scale up the cluster.
  6. Test scheduling parameters: Once pipes are built, routine jobs must be scheduled and executed.

Each of these steps requires different test data and different methods for trapping and diagnosing errors.  Therefore, the goal is to make sure to (1) tackle problems one at a time, and (2) solve each kind of problem in the environment with the fastest cycle time.

Steps 1 through 3 should be solved locally, using progressively larger data sets.  Steps 4 and 5 must be run remotely, again using progressively larger data sets.

Step 6 depends on your scheduling system and has a very slow cycle time (i.e. you must wait a day to test whether your daily jobs run on the proper schedule.).  However, it's independent of hadoop, so you can build, test, and deploy it separately.  (There may be some crossover with #4, but you can test this with small data sets.)

Going through six different rounds of testing may seem like overkill, but in my experience it's absolutely worth it.  Very likely, you'll encounter at least one new bug/mistake/unanticipated case at each stage.  Progressive testing ensures that each bug is dealt with as quickly as possible, and prevents them from ganging up on you.

Other suggestions:
  • Definitely use an abstraction layer that allows you to seamlessly deploy local code to your staging and production clusters.  Cascalog and mrJob are good examples.  Otherwise, you'll find yourself solving steps 2 and 3 all over again in deployment.
  • Config files and object-oriented code can reduce a lot of headaches in step 4.  Most of your deployment hooks can be written once and saved in a config file.  If you have strong naming conventions, then most of your filenames can be constructed (and tested) programmatically.  It's amazing how many hours you can waste debugging a simple typo in hadoop.  Good OOP will spare you many of these headaches.
  • Part of the beauty of Hive and HBase is that they abstract away most of the potential pitfalls on the deployment side, especially in step 4.  By the same token, tools like Azkaban and Oozie can take a lot of the pain out of step 6.  (Be careful, though -- each of these scheduling tools has its limitations.)

Monday, June 17, 2013

Scientists leaving the academy: Pushed, or pulled?

Several of my friends have shared and commented on this article in the Chronicle of Higher Education: "On Leaving Academe."  The author is Terran Lane, a former computer science professor at the University of New Mexico.

The article starts with the (shocking!) revelation that he is leaving his position as a professor to work for Google.  Lane then lists nine reasons for leaving:


  1. Making a difference
  2. Work-life imbalance
  3. Centralization of authority and decrease of autonomy
  4. Budget climate
  5. Hyperspecialization, insularity, and narrowness of vision
  6. Poor incentives
  7. Mass production of education
  8. Salaries
  9. Anti-intellectualism, anti-education, and attacks on science and academe


The tone is of the article is very negative.  Lane frames most of his complaints as forces that are pushing him out of the University. Honestly, it feels a little bit bitter.

As I've discussed this with friends, I've decided that I disagree with the tone, if not the reasons.  I've also made a similar decision to -- temporarily, at least -- leave the academy for the private sector.  But I see the whole experience in a much more positive light.

As I see it, there are growing incentives to find applications for science outside the academy. Since I've got into the startup world, I've met lots of psychologists, economists, and even the occasional political scientist who are building consumer-facing tools based on well-founded theories of social science.

To me, this feels like an emerging renaissance in applied social science. In other words, it's not just the case that smart, ambitious people are being pushed out of academia; they're being pulled out as well.

In the past, most careers paths allowed you to seek the truth OR change the world, but not both.  I'm optimistic that the rising volume and value of data is going to give more scientifically-minded people the chance to have their cake and analyze it too.  Eliminating artificial distinctions between "thinkers" and "doers" is good for society overall.


Monday, June 10, 2013

Crazy walls and dissertation graph insanity

Here's my dissertation to-do list from last week.  It's basically my own crazy wall (more here), on a clipboard.


More evidence of dissertation-induced insanity:
I made this graph last week, late at night, to answer a real research question.  ("What are the effective krippendorff's alpha scores of averaged ensembles of five mechanical turkers, given individual alphas of .2, .3, .4, and .5?")

When I woke up in the morning and looked at it again (and tried to explain it to Erin), I realized that the graph made no sense, and the process I had used to create it was completely bonkers.

I'm going to get through this thing.  But after the defense, I think I'm going to need some serious mental detox.


Moral of the story: friends don't let friends do PhDs.

Monday, June 3, 2013

A map of me: Life-tracking with funf


I've been running funf ever since I arrived in California -- almost six months now.  If you haven't seen it before, funf is a great little android app for passive life logging.  It can track anything your phone can track: GPS, accelerometer, battery, text messages, etc.

The downside is that it's buggy.  I ended up having to use a very hacky workaround solution to get my data off: exporting data via email, downloading the zips, then running the funf_analyze_mac script to parse them all to sql. It's a clunky pipeline, but works for the moment.

Here's the first payoff: a map of everywhere I went between November and February. It's pretty neat to be able to see the neighborhood where I work in San Francisco, the train line along the edge of the bay, the two cities where I've lived since moving here, and a few trips south and west to Los Gatos and San Jose.

I haven't done much work to make this beautiful, but I find it very engaging anyway.  (It's my data, after all.)


My next plan is to write a script to isolate places where I go often or spend a lot of time, and then mash those locations up with data from other sources based on timestamps.

Monday, May 27, 2013

Crocodile hunters versus zoo keepers: Aspiring data scientists should speak python


We're hiring data scientists at Jawbone, which means I've been spending a lot of time reviewing resumes and interviewing candidates.  Making the "bring him/her in" or "pass" decision dozens of times an hour has been a great opportunity to focus on the features that make great data science candidates stand out from the crowd.


What I've learned: Python is a great differentiator for job-hunting data scientists.  In the mix of resumes I review, it's the single biggest thing I look for.  Putting python high on your resume says, "Not only do I grok statistics/machine learning/R/SQL/Matlab/Octave/d3/etc, I can build the pipes and plumbing that make data systems work."

When I see resumes with strong background in practical programming, I think "Crocodile Hunter."  When those things are missing, I think "zoo keeper."  Zoo keepers aren't bad, but I find they need hand-holding every time you go into the jungle to wrangle wild data.

For whatever reason*, I find python sends a stronger signal of these skills than Java, C++, or any other mainstream programming language.  Not having python on your resume is a big handicap in the review process -- not an absolute deal-breaker, but in practice we hardly ever end up interviewing candidates without at least basic python skills.

With that said, "python" is an awfully big field to survey.  What python libraries are the most useful, really?  I've been asked this question several times recently.  Here's what I said in a recent email:
For python, I'd highly recommend installing ipython*, and getting your feet wet with the pandas library.  The matplotlibjson, and requests libraries are also good places to know your way around.  numpy and scipy have good stuff in them, but they're so huge that it's hard to really "know" them.  boto is also worth knowing, but it's only useful if you have a subscription to Amazon Web Services (AWS). 
For hadoop, I'd look specifically at mrJob.  It's a python-based wrapper that makes hadoop easier to use.  mrJob is too new to be covered in books yet, but the online documentation is pretty good.  You can use it in test mode even without installing hadoop.
Disclaimer: I know know that talking up one language over another is one of the cardinal sins of code. I don't want to start a religious war here -- I'm not saying that python is better than C++, or that pandas is the only way to manipulate data in python (although I believe Wes McKinney deserves a platinum-plated "better than sliced bread" award) -- I'm just saying that in the rough-and-tumble of the hiring process, data scientists with real python skills have a big advantage. 

Aspiring data scientists, you have been warned.

Practicing data scientists, what would you add to this list?  I've plugged in my favorite modules, but I'm sure there are others also worth a mention.


*I freely admit that the reason may just be in my head.  However, this preference for python also seems to be in a lot of other people's heads as well.  Whether there's a real reason for it or it's just an cognitive bias, it's working as a gating factor for a lot of resumes.

Monday, May 13, 2013

Simple ways to make prettier graphs

A question on graphs from my cousin. She's good with statistics, but not a programmer.  I've fielded similar questions many times, so figured it'd be worth putting the answer in the public domain.


Any graph that includes the caption "lunch" is a good graph.  Also "nap."
Quick question-- I'm writing up a paper right now and need to stick some simple graphs in. Do you have any suggestions ways to make graphs that are prettier than Excel to Word (low bar...ha ha! Accidental pun!)?
My response:

Love the pun. :)  [Miscellaneous personal stuff...]
On graphs: How many graphs are we talking?  If it's just a handful, or if they're all different kinds, I'd recommend Photoshop or Illustrator.  Import the graph from excel, and then "trace over" it to give it the styling you'd like.  A lot of great data-centric presentations use this trick. 
Another option is tableau.  It's a pricey, but gives you good tools for designing nice-looking graphs, as well as tools for automating them (i.e. generating 20 graphs with the same basic template.) You might be able to use a 30-day trial; and maybe their student licenses are cheaper than the corporate ones. 
If you don't want to shell out for tableau and you're doing *lots* of graphs in the same style, then it might be worth climbing the learning curve for matplotlibggplot2, or the google charts API.  I doubt this is worth your time because, there'd be such a long learning curve: each of these is a graphing library on top of a programming language, and you'd need facility with both to make them work.
Getting graphs right is fiddly work.  All those axis and labels and spaces to play with, and that's before you even begin to think about borders and color.

I've toyed with the idea of a declarative language for graphs: a syntax for describing the story you want told, without including all the execution details.  For example, "A is more Y than B" should give you a nice bar chart with a tall column labeled "A," and a shorter column labeled "B."  The y-axis should be labeled "Y."

This strikes me as a difficult, but maybe not an impossible challenge...

Monday, May 6, 2013

Sadly, I'm not developing tengolo. Would you like to run with it?

A little over a year ago, I announced that I was working on tengolo, a python alternative to netlogo.  I'm not actively developing it -- didn't get much farther than a rough proof-of-concept, really -- but I still get questions about the package.

As a result, I find myself writing some variation on the email below at least a couple times a month:

Dear python/ABM enthusiast - 
Glad you're interested in python and ABMs.  I started on tengolo after a thorough search turned up no good ABM frameworks in python.  I worked on it for a short while, then moved on when my dissertation committee told me to focus on stuff that would actually help me graduate. :) 
I got far enough in to be confident that a python-based ABM framework like tengolo could work. All the code is in the github repository, and every month I get questions from people asking if it's being actively developed. There's clearly demand for the project, but I don't have time to support it at this point.  I'd love to see someone take this ball and run with it. 
Best,
Abe

Would you like to run with this project?  If you're good with python and want to run a potentially popular academic open-source project, tengolo would be a great fit.  Please get in touch, and I will happily direct potential users and collaborators in your direction.


Saturday, April 13, 2013

Python multiprocessing: 8x speed in 8 lines of code

At work last week I demo'ed some python parallel processing tricks.  Nothing fancy -- just standard usage of the multiprocessing library -- but these things can be a revelation if you haven't seen them before.

Like many things, python makes basic multiprocessing very easy: ~8 more lines of code can let you use all 8 cores of your laptop.  In practical terms, it's lovely to improve your workflow from "run algorithm preprocessing overnight" to "run algorithm preprocessing during lunch."


Here's how it's done.

from multiprocessing import Pool

def my_function( a_single_argument ):
    # e.g. "accepts a filename and returns results in a tuple"
    ...

my_data_list = [...]
my_pool = Pool()
my_results = my_pool.map( my_func, my_list )

That's all it takes.  A few tips:

First, the mapped function can only accept a single argument.  This is usually pretty easy to solve, by wrapping the arguments as a tuple:

def my_function( threeple_arg ):
    arg_1, arg_2, arg_3 = threeple_arg
    ...

Second, debugging in multiprocessing is a pain.  I often invoke the function this way first for debugging, then switch to multiprocessing once I know everything works:

#my_results = [my_func(item) for item in my_data_list]

It's a little hacky, but I'll often leave the line as a comment throughout development, switching between serial and parallel processing as need demands.

Last, a hint on Pool: you can pass an integer to the initialization routine to tell it how many subprocesses to use:

my_pool = Pool(5)

If you omit the argument, python assumes you want to run as many subprocesses (not threads!) as you have cores (e.g. 8 on a MacBooks pro).  If you want to save some processing power for other tasks, you might want to specify something lower, like 6.

If you're running tasks with high latency (e.g. web spidering, or lots of disk read/writes across a network) it sometimes makes sense to use more subprocesses than you have cores.  For example, I'll often throw 40 pool workers at a quick web-scraping script, just to speed things up.  However, if performance really matters, Pools with latency are very hard to tune and scale.  For anything more than a one-off data grab, you'll be better off with a queue-based tool, like scrapy, Amazon SQS, or celery.

HTH

Friday, March 15, 2013

Hacking Scrabble with Cascalog


We've barely met, but I am in love with Cascalog.  So elegant.  So powerful.  So easy to ship from testing to staging to production.  So perfect for the workflow abstraction where most data science happens.  Let me count the ways...


The only downside is the shortage of documentation and examples. There's an active google group, yes, but only a handful of cascalog questions on StackOverflow.  So I thought I'd pay things forward by tossing out a bunch of toy examples that I used in my early experiments with the language.  These examples cover clojure's basic syntax and regular expressions, plus cascalog's filtering and basic aggregations.  I'll save tests, joins, etc. for a later post.

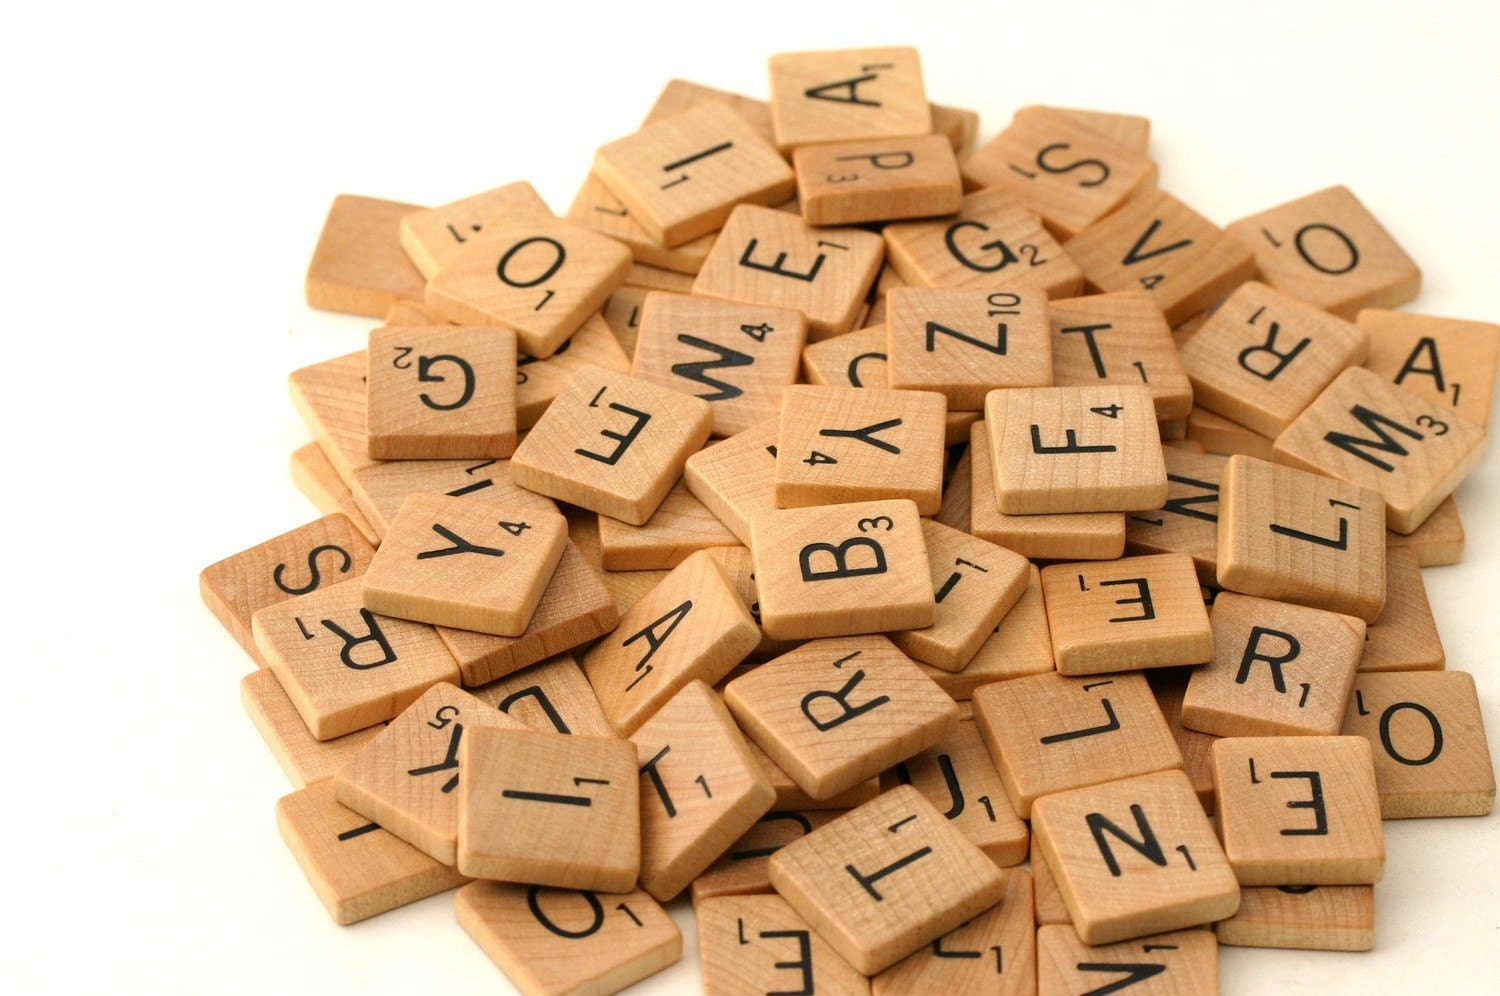
All these examples use the Scrabble Word dictionary, which provides a nice bite-sized playground for lots of MapReduced fun.  The Tournament Word List is a list of all the legal words for Scrabble in U.S. tournament play.  Words are in all caps and separated by line breaks.  I downloaded and saved the file as /Users/agong/Data/scrabble-list-twl06.txt.  To speed up testing, I also sampled rows at random to create a 10% sample (/Users/agong/Data/scrabble-list-twl06-1pct.txt) and a 1% sample (/Users/agong/Data/scrabble-list-twl06-1pct.txt).


First, let's try a vanilla query: just print all the lines in the file. This will help make sure clojure and hadoop are set up properly.

; vanilla query: print all lines
(?<- (stdout) [?word]
((lfs-textline "/Users/agong/Data/scrabble-list-twl06-1pct.txt") ?word))

If that works, we can do some basic filtering.

; basic filter: print lines starting with 'z'
(?<- (stdout) [?word]
((lfs-textline "/Users/agong/Data/scrabble-list-twl06-1pct.txt") :> ?word)
(clojure.core/re-matches #"Z.*" ?word) ))

So far so good. We have Hello world, and basic filters check out.  Let's use the count aggregation to count the number of words in the sample:

; count words
(?<- (stdout) [?count]
((lfs-textline "/Users/agong/Data/scrabble-list-twl06-1pct.txt") ?word)
(cascalog.ops/count ?count) ))

Now let's build up to letter counts (a twist on the classic MapReduce word count example.)  To get there, we need to define a map cat operator:

; split words into letters
; https://github.com/sritchie/cascalog-class/blob/master/src/cascalog_class/core.clj
(defmapcatop split
 "Accepts a word and emits a single 1-tuple for each letter."
 [word]
 (clojure.core/re-seq #"." word))

; count letters
(require `cascalog.ops)
(?<- (stdout) [?letter ?count]
((lfs-textline "/Users/agong/Data/scrabble-list-twl06-1pct.txt") ?word)
(split ?word :> ?letter) (cascalog.ops/count ?count))

With these very simple tools, we can do a surprising number of interesting things. Let's create a function to do n-gram counting, modified slightly from this example.

; count ngrams
(defmapcatop ngrams
 "Accepts a word and n-parameter and emits a single 1-tuple for each n-gram."
 [word n]
 (map my-join (partition n 1 word)))

Now we can count bigrams and trigrams:

; Character bigrams
(?<- (stdout) [?letter ?count]
((lfs-textline "/Users/agong/Data/scrabble-list-twl06-1pct.txt") ?word)
(ngrams ?word 2 :> ?letter) (cascalog.ops/count ?count))

; Character trigrams - no sampling
(?<- (stdout) [?letter ?count]
((lfs-textline "/Users/agong/Data/scrabble-list-twl06.txt") ?word)
(ngrams ?word 3 :> ?letter) (cascalog.ops/count ?count))

Let's get word lengths...

; get word lengths
(defmapcatop get-len
 "Accepts a word and emits a single 1-tuple with its length."
 [word]
 [(.length word)])

; distribution of word lengths
(?<- (stdout) [?length ?count]
((lfs-textline "/Users/agong/Data/scrabble-list-twl06-1pct.txt") ?word)
(get-len ?word :> ?length)
(cascalog.ops/count ?count))

I guess it makes sense that the longest words in scrabble are 15 letters long...

Now let's combine filters and aggregators.  We need to create a filter operation for this...

(deffilterop len-n? [word n]
 "Keep only words not of length n"
 (= (.length word) n))

; distribution of lengths for 7-letter words (a silly example to make sure it worked)
(?<- (stdout) [?length ?count]
((lfs-textline "/Users/agong/Data/scrabble-list-twl06-1pct.txt") :> ?word)
(len-n? ?word 7)
(get-len ?word :> ?length)
(cascalog.ops/count ?count))

Vowel dumps are an important part of scrabble tactics: words that let you get rid of extra vowels without wasting a turn to exchange your hand.  First, we can do pure vowel dumps -- words that include no consonants at all.  (We'll grant Y vowel status, even though it only qualifies sometimes.)

; vowel dumps
(deffilterop pure-vowel-dump? [word]
 "Keep only words containing only vowels (and sometimes y)"
 (every?
  (into #{} (clojure.core/re-seq #"." "AEIOUY"))
  (clojure.core/re-seq #"." word)))

(?<- (stdout) [?word]
((lfs-textline "/Users/agong/Data/scrabble-list-twl06.txt") :> ?word)
(pure-vowel-dump? ?word))

Hm. There aren't very many of these pure vowel dumps.  How about a more flexible function that calculates the proportion of vowels in the word?

(defmapop vowel-ratio [word]
(/
    (.length (clojure.string/replace word #"[AEIOUY]" ""))
    (.length word)))

Now we can look up words with 70% or more vowels.  For good measure, let's show the ratio of vowels in each.

;Ratios for vowel dumps
(?<- (stdout) [?word ?ratio]
((lfs-textline "/Users/agong/Data/scrabble-list-twl06-1pct.txt") :> ?word)
(vowel-ratio ?word :> ?ratio )
(> ?ratio 7/10))

Among these vowel dumps, what's the distribution of lengths?  The distribution of letters?

;Length distribution for vowel dumps
(?<- (stdout) [?length ?count]
((lfs-textline "/Users/agong/Data/scrabble-list-twl06.txt") :> ?word)
(vowel-ratio ?word :> ?ratio )
(> ?ratio 7/10)
(get-len ?word :> ?length)
(cascalog.ops/count :> ?count))

;Letter distribution for vowel dumps
(?<- (stdout) [?letter ?count]
((lfs-textline "/Users/agong/Data/scrabble-list-twl06.txt") :> ?word)
(vowel-ratio ?word :> ?ratio )
(> ?ratio 7/10)
(split ?word :> ?letter)
(cascalog.ops/count :> ?count))

Okay, a few more fun examples.  Palindromes...

;Palindromes
(deffilterop palindrome? [word]
 "Return true for palindromes"
 (= word (clojure.string/reverse word)) )

(?<- (stdout) [?word]
((lfs-textline "/Users/agong/Data/scrabble-list-twl06.txt") :> ?word)
(palindrome? ?word))

;Distribution of letters in palindromes
(?<- (stdout) [?letter ?count]
((lfs-textline "/Users/agong/Data/scrabble-list-twl06.txt") :> ?word)
(palindrome? ?word)
(split ?word :> ?letter)
(cascalog.ops/count ?count))

Not a whole lot of these either.  What about vowel-consonant palindromes?  That is, words where the back-to-front and front-to-back ordering of vowel consonants is the same?

;Vowel-consonants palindromes
(deffilterop vc-palindrome? [word]
 "Return true for vowel-consonant palindromes"
 (let [vc-word (clojure.string/replace (clojure.string/replace word #"[AEIOUY]" "A") #"[^A]" "B")]
  (= vc-word (clojure.string/reverse vc-word)) ))

(?<- (stdout) [?word]
((lfs-textline "/Users/agong/Data/scrabble-list-twl06-10pct.txt") :> ?word)
(vc-palindrome? ?word))

There we go!  From ANALYZE to ZYMOSIS.  (Your words will probably be different, because of the sampling.  But they will still be v/c palindromes. :) )

I had fun spending an afternoon putting together these examples.  It was a great, well-bounded way to get my feet wet with clojure and cascalog.

HTH

Monday, March 11, 2013

Definitions for data science


Since I'm rebooting this blog, this seems like a good moment to lay out a framework for data science.  I'll tackle definitions now, and process next time.


Pinning down scope and definitions is important for data science, because the field is growing rapidly, with a sense that the sky is the limit.  Without priorities and a grasp of what data science isn't, we run the risk of overreaching, wasting our time, and leaving everyone disappointed.  I won't claim that my definition is the only definition, or even the best definition.  But it works for me, and it has some virtues worth discussing.

Essentially, I think of data science as "answering questions with data," or more precisely, "providing empirical answers to well-posed questions." By empirical, I mean "based on information that all participants can observe in common."  By well-posed, I mean "admitting a definitive answer": once we see the right answer, we can all agree that it's the right one. In the language of formal logic, a well-posed question is one that admits a deductively valid conclusion.  So, data = empirical, science = questions.

The main difference between my definition and most of the others floating around (e.g. here) is that I focus on the goal of data science (answering questions), not the tools or methods for getting there (e.g. data munging, predictive analytics, writing mapReduce queries).

I find that defining data science by goals instead of tools adds clarity, for two reasons.  First, goals usually provide a more defined boundary than tools.  Almost none of the tools of data science are unique to data science. Software engineers do lots of "hacking"; forecasters do lots of statistical modeling; DB admins use plenty of NoSQL.  None of these things on its own provides a bright line for determining who is a data scientist or not, so we have to take a fuzzy average over lots of categories, and end up with a large gray area of jobs that are "kind of" data science. In contrast, it's usually pretty clear if your goal is answering questions (a.k.a. "providing insight," "running analytics," "informing decisions") or not.

Second, focusing on goals lets us differentiate approaches by effectiveness. Without a clear understanding of the job of data science, it's impossible to tell the difference between professionals who choose the right tools to get the job done, and bandwaggoners who are just playing with every shiny new toy.  Since the bandwagoning has started already, I think we'll be well served to differentiate between effective data scientists and the tools they use.

Analogy: I'm in the hospital for an appendectomy as I write this, going under the knife in a few hours.  I find it much more comforting to think of the doctors in terms of goals ("People who help you regain their health") than tools and methods ("People who cut holes in you with scalpels and wires").  Similarly, I'd be much happier hiring a data scientist who is good at answering questions, than one who is good with mongoDB, or Bayesian models.  Having the tools is necessary but not sufficient to accomplish the goals.

With those ideas on the table, here are some comparisons I'd like to explore in the future:

  • How is data science different from "big data"?
  • How is data science different from statistics?
  • How is data science different from data analysis?
  • How is data science different from science in general?
  • How is data science different from software engineering?

What do you think?  Discuss.

Wednesday, March 6, 2013

Notes on Data-driven Design in the 2012 Obama campaign


Just got out of a presentation by Josh Higgins and Dan Ryan, two of the technical leads on the 2012 Obama campaign.  Really great presentation on designing and optimizing campaign tools using the latest and greatest in web development techniques.


Takeaways:

  • Campaigns have three goals: (1) raise money, (2) persuade voters, (3) get out the vote.
  • The tools built in 2012 made that campaign 28% more effective than the '08 campaign.
  • The campaign was won by volunteers' "boots on the ground," but really good tech acted as a "force multiplier" for limited volunteers.
  • The team would run 16 or more A/B tests in a day.  More than a thousand tests over the course of the campaign.
  • Each test needed a clear question and hypothesis so that there would be permanent learning from the experiment.
  • The campaign raised $690,000,000 online, and average of a little over $100 for 4 million donors.  This was the first campaign to raise more money online than off.
  • $125,000,000 of that total was due to testing -- improvements in interventions that earned more money.
  • Spending lots of time on beautiful design didn't always work. "Sometimes ugly sells."
  • Lots of predictions were wrong. "Don't think you know anything until the data tells you so."
  • The facebook tool for "social canvassing" was "creepy awesome": given user permissions, the tool would crawl your timeline and all your friends' profiles, to identify friends who are (1) socially close, and (2a) physically close or (2b) in a battleground state.  Close to election day, the app sent reminder messages (lots of them!) urging volunteers to remind their friends to vote.
  • Based on the voter file, 5 million facebook volunteers mobilized 7 million facebook-only voters -- voters for whom facebook was the campaign's only method of contact.  In the end, Obama won the popular vote by 5 million votes.  "This was our way of knocking on doors." "We won the popular vote with facebook."
  • Targeted splash pages during the conventions doubled the take from fundraising with half the asks.
  • "Drunk emails before midnight": on drinking holidays (New Years Eve, St. Patrick's Day, etc.) the campaign would send to previous donors mails (subject line: "Hey!") with a one-click donation link.  "We raised millions."  Way to target the perfect moment!
  • Custom data tools that worked particularly well: narwhal, the campaign's unified data warehouse; quickPayment, a database for storing required FEC info to take the friction out of donations.


Great example of the power of data and fast development cycles.

PS: I want a picture of a triumphant Obama riding a narwhal, in the style of Abe Lincoln riding a bear.

Wednesday, February 20, 2013

Data can't do everything. So what?


*Sigh*  This article again.  The one that says, "Data can't do everything."  This time, David Brooks happens to be the one writing it, but it could have been anybody, really.  Brooks gives a list of things that he feels data does poorly ("context", "big problems", "the social"), and then concludes with this gem:
"This is not to argue that big data isn’t a great tool. It’s just that, like any tool, it’s good at some things and not at others."
Well, duh!

I'm tired of reading the many incarnations of this article, for two reasons.

  1. It's obvious. Good data analysts (and anybody with half a brain) is already aware of these kinds of limitations.
  2. It doesn't move the debate forward. In fact, it clouds the issue.
The debate about data is a debate about scope: "What can and can't be accomplished with data?" This isn't a question that can be resolved using vague generalities.  For example, the following logic (based on one of Brooks' rules of thumb) doesn't work: "Well, building a platform where millions of people can share ideas in real time (e.g. twitter) is a 'big problem,' so I guess it can't be solved with data.  But convincing my toddler to stop throwing milk at dinner is a 'small problem,' so bring on the statistics!"

If you want to know whether data can help answer a question, you have to look at the structure of the data: What variables are available? What are the units of analysis? How are the data structured across time? Are there any plausible sources of exogenous variation (e.g. instrumental variables or "natural experiments")? These are the right questions to ask. Hazy adjectives like "big" or "social" simply aren't useful.

It's as if Brooks is claiming he can fix your car without opening the hood. "You can fix red SUVs by flushing out the engine." "You can answer big, social questions by relying on values." A real mechanic would get inside the machine and actually see how it works. "Hmm... for this particular big, social question, you have lots of data on X and Y, and a little bit on Z, and this portion was captured as part of an experimental design.  That means we can infer A, but we can't infer B..."

"I still say we're both entitled to our own methods of fixing the car."

Data can't do everything.  Not even close.  But we live in a world swimming in data of increasingly useful types.  It seems reasonable to think that we'll be able to do more with that data once we figure out what it's good for.  And we can't do that by burning the strawman of omnipotent data, or by trading in mushy platitudes.  We need to get specific about real questions and data structure.

Tuesday, February 5, 2013

...and we're back!


I'm back! Life took a sudden turn this summer: I went to the Bay Area for a wedding, lined up some informational interviews around data science, and found myself hired by a fantastic little startup, which then got acquired by a fantastic big startup.  I spent the summer working feverishly on my dissertation, then moved out to San Francisco at the beginning of December. It's been an awesome and surprising ride: like crashing a bicycle into a pool full of bacon.


Up until now, I couldn't tell the story, because the acquisition of Massive Health (the fantastic little startup) by Jawbone (the fantastic big startup) wasn't finalized or public until yesterday. Also, I was super busy.

With these issues resolved, I mean to reopen this blog. The focus is still data, especially opportunities for better living through data, and the day-to-day work of professional data science.

Really, there are two questions I expect to come back to over and over:
  • What is data science, how is it practiced, and how should it be practiced?
  • How can personal data make life better for people?  Like me, for example.
One thing I won't write much about is products and data systems at Jawbone. The company is doing awesome, forward-looking R&D in several areas, but we are supposed to keep a lid on it until the proper moment. Because of that, I'll focus more on process, possibilities, introspection, and nifty stuff popping up around data science writ large.

If you have thoughts of questions or ideas on these topics, please engage! The world is full of data, and we're still learning how to make it useful. I'm looking forward to the conversation.  Cheers!